A Tactical Shift in Municipal Investments - The Baker Group
July 26, 2018
Prior to the beginning of 2018, a year with the largest tax reform measures enacted since the 1980s, many investors were concerned that under lower tax rates demand for tax-exempt municipals would fall. So far, that hasn’t played out. The reason for this is twofold: (1) a significant drought in supply and (2) tax rates for most muni buyers are only modestly lower.
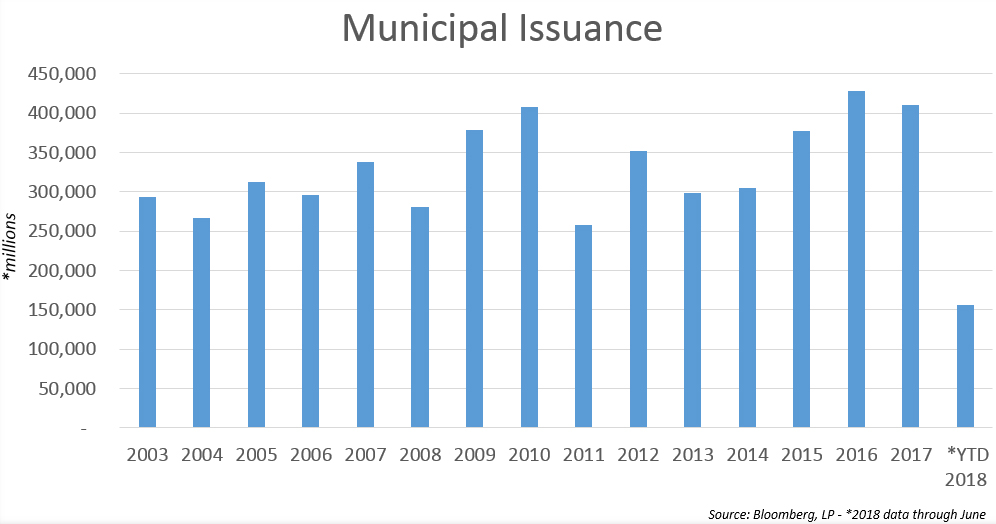
Limited supply for the sector is a simple product of the rate cycle. Interest rates are higher, resulting in less refunding activity. Through July of this year, total municipal issuance was down nearly 17% from the same time last year (Figure 1). Moreover, projections for year-end supply might result in the lowest issuance for the sector since 2011. Mutual fund inflows for munis have remained positive. The reason for this is that the largest buyers of munis, individuals and households, experienced only a modest reduction in their tax rates. The biggest drop in tax rates came from a reduction in the top corporate rate from 35% to 21%. Muni buyers subject to this tax cut include insurance companies and C-corp banks. These institutions comprise about 30% of muni holders, and it’s here where the market has seen some material changes in demand for certain tax-exempt munis.
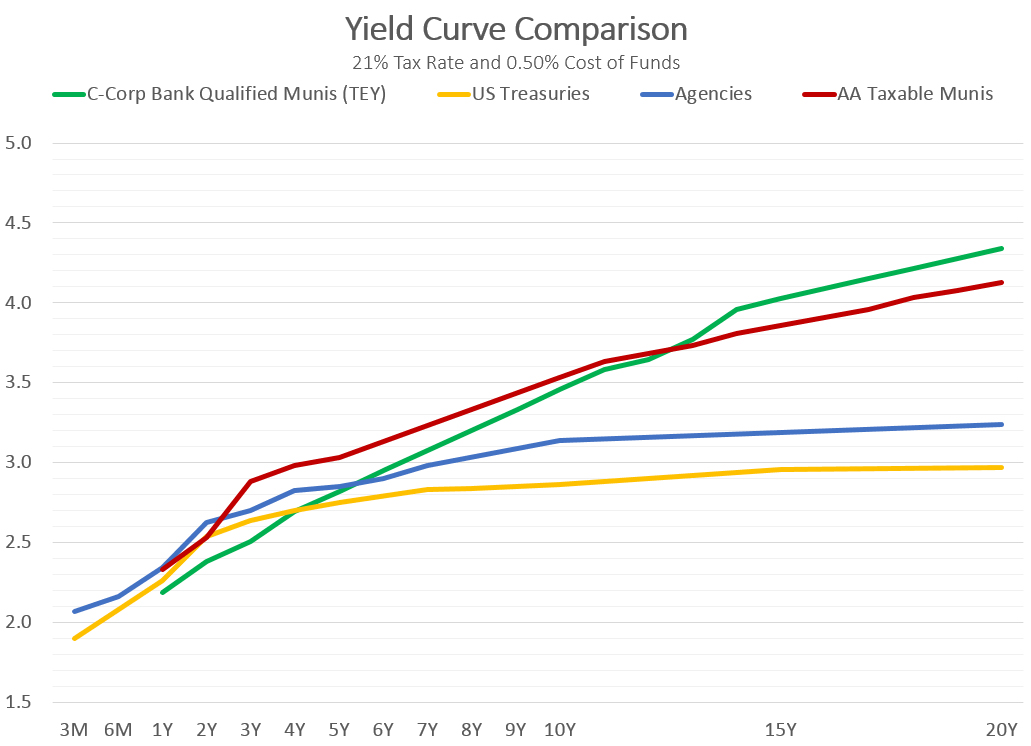
Prior to the tax cuts, institutional muni buyers subject to the highest tax rates saw positive spreads to Treasuries across the curve. In other words, while the widest spreads to Treasuries were found in longer dated municipals, there were still positive spreads on even the shortest of maturities. This allowed institutions to ladder out their purchases in whatever way they saw fit and still achieve a yield advantage over taxable alternatives. Today, at a 21% tax rate, that’s no longer the case. As shown in Figure 2, the green line represents Tax Equivalent Yields (TEY) for Bank Qualified Tax Exempt Munis at a 21% tax rate for various maturities across the curve. At this tax rate, muni TEY spreads are negative to Treasuries (in yellow) inside 4 years and negative to Agencies (in blue) inside 5 years.
This has created the need for a tactical shift for muni buyers subject to the 21% tax rate. Most of these buyers have historically seen better relative value in longer dated munis. However, for those that buy shorter dated tax-exempt munis, a revision in strategy is warranted. Of course, this doesn’t mean the only alternative is to buy bullet Agencies or Treasuries. Instead, buyers needing to fill shorter maturities should look to the taxable muni market. In Figure 2, the red line represents yields on AA rated Taxable Munis across the curve. Notice that this sector maintains positive spreads to both Agencies and Treasuries from the 2-year point and beyond. These taxable muni yields also have positive spreads on a TEY basis to our Bank Qualified Tax Exempt Munis in the 2-10 year part of the curve. Taxable muni spreads have been trading between 25-50bps over Treasuries for most of the year.
Much has been made of the late cycle behavior financial markets have been exhibiting this year. Whether or not the Fed will continue on its course to increase short-term rates remains to be seen. The spread between 2-year and 10-year Treasury yields is currently just under 30bps, the tightest since 2007. Absent a material increase in longer dated Treasury yields, that doesn’t leave much room for the Fed before the curve inverts. Now more than ever, institutional investors need to maintain a proactive strategy that identifies the best relative value on sector allocations and duration targets. It’s impossible to know when the next economic cycle will begin and rates start to fall. Therefore, investment decisions cannot be based on an isolated path for interest rates. Identifying the best relative value within each fixed income sector is crucial and laddering out various maturities across the yield curve can help hedge against multiple rate path scenarios. As of now, taxable munis offer the best relative value in the short end of the yield curve.
Drew Simmons serves as Senior Vice President at The Baker Group, where he works with community bank needs pertaining to interest rate risk, asset/liability management, and fixed income portfolio management. He created the firm’s municipal credits database, and is a frequent speaker at banking schools and financial seminars.
Contact: 800-937-2257, drew@GoBaker.com.